PAPER-DIGEST · 2026-08-24
Hu et al.: We Judge Others' Satisfaction Without Counting Their Options — Fukai Reads
Behavioural science / choice set size / reading playtests and data
TL;DR
"A side dish you picked from six options tastes better than the same dish picked from two." Today I read a psychology paper that checked this with over ten thousand people. And here is the real point. Your own satisfaction moves that way, yet when you predict someone else's satisfaction, you barely account for how many options they had. Hades (Supergiant Games, 2020), gameplay image from its Steam store page. Unrelated to the paper; cited as a well-known example of "pick one of three" design.
Six experiments, all preregistered, 10,092 participants in total. It was published in Psychological Science, so it has been through peer review. As psychology findings go, this one stands on fairly solid legs.
For those of us who make games, this is not somebody else's problem. We spend most of our working day in the seat of the person predicting someone else's satisfaction: watching playtests, counting pick rates, reading reviews. Every one of those tools quietly deletes the number of options the player was looking at.
About this paper
There are three authors: Beidi Hu (Booth School of Business, University of Chicago), Alice Moon (McDonough School of Business, Georgetown University) and Eric VanEpps (Owen Graduate School of Management, Vanderbilt University). All three are marketing researchers.
It appeared in Psychological Science, published online on 7 January 2026. It is peer-reviewed and open access, so anyone can read the full text. The title is "Choice Set Size Neglect in Predicting Others' Preferences".
I picked it today for two reasons. The first is reliability. Findings in psychology sometimes fall apart later, when someone runs the same study again to check it. This paper preregistered all six experiments — that is, the hypotheses and analysis plans were posted before the data came in — and the materials, data and analysis scripts are all public. It was built to survive that kind of scrutiny.
The second reason is that the setup looks remarkably like game development. The paper is about estimating, on someone else's behalf, how happy they are with what they chose. That is what we do every day.
One caveat up front. There is not a single line about games in this paper. The materials are restaurant side dishes, a vote, and a charity donation. Carrying it over to games is my work, not something the authors vouched for.
Background: what we already knew about set size
Start with something plain but solid. A bigger set is more likely to contain something that fits your taste. Choosing from eight raises your odds of landing on a favourite compared with choosing from two. The authors take this as their starting point.
But more is not always better. The famous case is the jam study reported by Iyengar and Lepper in 2000: when a tasting table offered many jams instead of just a few, fewer people bought any. This "choice overload" — the phenomenon where too many options lower satisfaction or stall the decision — has been studied a great deal since. The 2015 meta-analysis by Chernev and colleagues, which pools many studies statistically, treats it as an effect that appears under some conditions and not others.
All of that is about choosing for yourself. What happens when you watch someone else choose? Here the authors bring in "correspondence bias", the tendency to explain another person's behaviour by their character rather than their situation. It is an old line of work starting from the experiment Jones and Harris reported in 1967, and the upshot is that observers discount the force of the situation.
The authors also cite work by Barasz and colleagues showing that people read too much into an observed choice. When we see someone pick something, we infer a lot about their taste. But the condition of how many options sat in front of them had not been examined.
So the paper's question is this: when people predict another person's satisfaction, do they account for how many options that person had? The authors predicted that they mostly would not. They call it choice set size neglect.
Method: what the six experiments did
The method is straightforward. Read a scenario, then rate satisfaction as a number. The only thing that changes is whether you are choosing for yourself or predicting someone else's satisfaction. Repeat six times with different twists. Participants were U.S. adults recruited through online research platforms.
Study 1 (1,993 people) used restaurant side dishes: spring mix salad, fresh fruit cup, roasted snap peas, mac and cheese, seasoned fries, onion rings. One condition chose from six, another from two. Half the participants chose for themselves and rated their liking from 1 to 7; the other half predicted a stranger's liking on the same scale.
Study 2 (3,148 people) widened the set sizes to two, four, six and eight, and switched to a finer 0-100 scale. Those two studies establish the basic pattern.
The remaining four ask what reduces the neglect. Study 3 (587 people) showed one person who chose from six and another who chose from two at the same time — what the literature calls joint evaluation. Study 4 (1,578 people) showed the other person's behaviour as a full ranking rather than as a single pick, across two scenarios: side dishes and a vote. Study 5 (1,201 people) had a waiter say the number out loud — "we offer two [six] side dish options" — and then asked participants to recall how many there had been.
Only Study 6 (1,585 people) is not hypothetical. Participants did real work, alternately pressing "a" and "b" two hundred times, and earned a fifty-cent bonus. They then chose a charity from six options (or from two) and decided how much of the bonus to give, from zero to fifty cents. The predicting side guessed other participants' donations and liking, with a bonus for being close.
Findings: only your own satisfaction moves
Study 1 is the paper's backbone. Choosing for themselves, people who picked from six rated their liking at 6.21 on average, against 5.91 for those who picked from two (d = 0.29; Cohen's d is a standardised measure of the size of a difference, where about 0.2 counts as small and about 0.5 as medium). Predicting someone else's liking, the same contrast was 5.72 against 5.67, with no statistical difference (d = 0.06). Set size moved only the chooser's own satisfaction.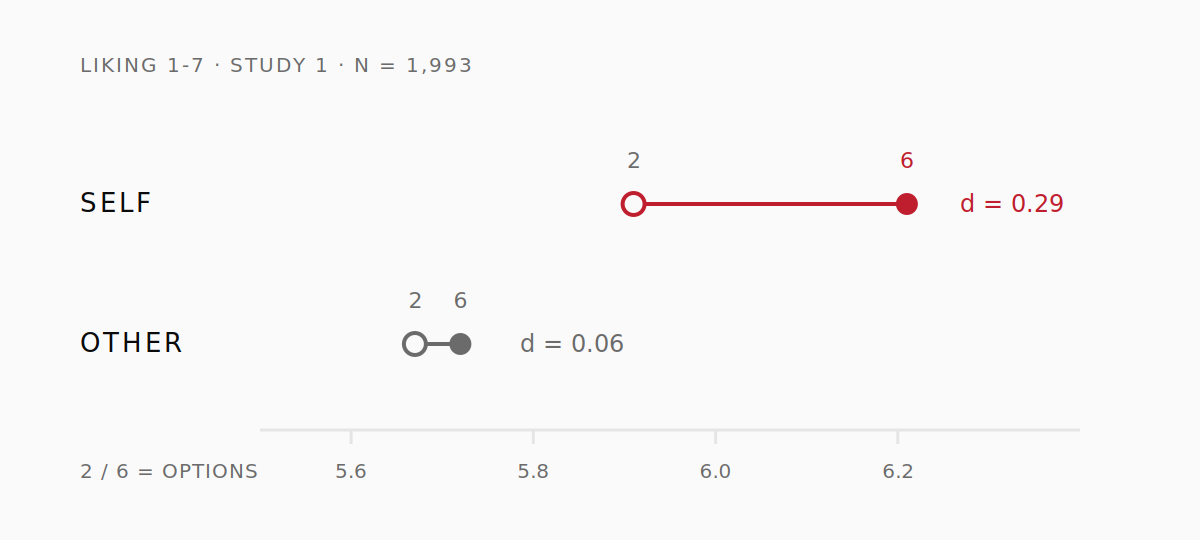 (Diagram) Study 1. When choosing for yourself (SELF), liking moves with the number of options; when predicting for someone else (OTHER), it barely moves. Values are the paper's means and Cohen's d.
Study 2 produced the same shape. The slope by which liking rose with set size was more than three times steeper for oneself (coefficient 3.02) than for predictions about another person (0.85). Note that the prediction side is not flat. The neglect is better read as "weighted too little" than as "ignored completely".
The rest of the paper is about remedies. In Study 3, showing the person who chose from six and the person who chose from two side by side widened the gap to d = 0.95 (6.03 against 4.81). Shown separately, it stayed at d = 0.26. Put the two cases next to each other and people do take set size into account.
Study 4 works similarly. Presented as a single pick, the gap was d = 0.15. Presented as a ranking of all the options, it was d = 0.52. A ranking format puts the options that were not chosen back into view.
Study 5 used a simpler intervention: have the waiter state the number of options, then ask the participant to recall it. That alone moved the gap from d = 0.30 to d = 0.59, roughly doubling it. Nothing about the target or the scenario changed. The only change was whether attention was drawn to the number. Note that in Study 5 even the control condition showed a small gap. The scenario and the scale differ from Study 1, so the numbers cannot be lined up directly.
Study 6 found the same shape with real work and real money. Choosers rated 5.32 (from six) against 4.95 (from two). The prediction side gave 5.11 against 5.19 — the difference even pointed the other way. As a side finding, predictors estimated other people's donations at 18.01 cents on average, while the actual average was 13.64 cents. People overestimated how generous others would be.
Use cases: five things a game maker can take home
First, the most practical one. A playtest survey should ask testers to rank every option rather than pick a single favourite. The Study 4 contrast (d = 0.15 against 0.52) shows that changing the format puts set size back into the reader's field of view. Those of us reading the answers should make fewer mistakes with a ranking in front of us.
Second, how to read pick rates. "Weapon A was chosen 70% of the time" means different things when the pool held three options and when it held twelve. In the paper's terms, observers overcommit to the observed choice. The authors themselves warn that this habit can lead a business to narrow its offerings for no good reason. Cutting the options nobody picks may be cutting the source of the satisfaction.
Third, the roguelite "pick one of three". At least on the chooser's side of the data, the number of offers is itself a satisfaction dial. The awkward part is that the team's intuition cannot feel that dial turning. Reducing the offer count from four to two will look like "not much difference" in an internal forecast. It is exactly the kind of change to settle by measurement rather than instinct. Vampire Survivors (poncle, 2022), gameplay image from its Steam store page. Unrelated to the paper; cited as an example of picking one from a handful of offers at each level-up.
Fourth, an unglamorous proposal about dashboards. In Study 5, merely restating the number of options doubled the effect. So put "options offered: N" next to every pick-rate chart. Write "four candidates were on screen here" into the playtest clip notes. Following Study 3, showing two groups with different offer counts side by side should help as well.
Fifth, a word about daily puzzles like ours. Letting players choose today's puzzle from three, or expanding hints from one kind to several, is the sort of decision where an internal estimate will show little difference. If we ship it, I want to measure the satisfaction of people who actually played before deciding. The conclusion is the same: do not lean on the team's forecast.
Limitations: what the authors admit, and what I noticed
Start with what the authors admit. They note that predictions might be more accurate for close friends, whose tastes you know. Every target in these studies was a stranger.
They also note that the sets ran from two to eight options — "relatively small" in their own words — and allow that extremely large sets, where choice overload kicks in, may behave differently. As future work they raise whether expertise moderates the effect, offering the contrast of a sommelier and a general manager.
My own points start with the size of the effect. How much of the result is explained by the combination of "self or other" and set size stays under one percent in the paper's own numbers. The accurate phrasing is "small but stable across six experiments and ten thousand people", not a dramatic bias.
Next, the materials are all one-shot, low-stakes choices: a side dish, a vote, a donation of a few dozen cents. Games are environments where the same kind of choice repeats hundreds of times. Whether repetition shrinks the neglect or hardens it lies outside this paper.
Third, what is measured is liking for the chosen option, not satisfaction with the game or with the session. The applications I wrote above cross that gap on my own judgement. Whether you want to cross it too is a separate question.
Fourth, participants were U.S. adults only, and cultural differences were not examined. I should also add that the paper is new enough that neither replications nor wider discussion have begun.
How Fukai reads it
This section is my own reading. I would rather take this study as a paper about our habits of measurement than as a psychology finding. A development team sits, structurally, in the observer's chair forever. And our instruments — the pick-rate bar chart, the one-line playtest note, the quoted store review — all share a format that throws away how many options were on the table. What Study 5 showed is that writing that discarded line back in can change what we see. In the vocabulary of design criticism, this reads as a proposal to promote set size from background context to a recorded data field.
Closing: what to read next
If you want to dig further into set size, the quickest entry is the jam experiment by Iyengar and Lepper (2000), about too many options stopping people in their tracks. Reading the 2015 meta-analysis by Chernev and colleagues after it raises the resolution of the map, because it shows the effect appearing and vanishing with conditions. Baba Is You (Hempuli, 2019), gameplay image from its Steam store page. Unrelated to the paper; cited as an example of a design where few options still produce deep satisfaction.
If you would rather come at it from correspondence bias, go back to the classic study by Jones and Harris (1967), the origin of the idea that we blame character rather than circumstance for other people's behaviour. Today's paper reads as adding one item — set size — to that list of things observers discount.
One last note. The paper is new, and neither replications nor wider discussion have started. I will carry home only "under these conditions, that tendency was observed", and hold off on anything stronger. Even so, writing the offer count next to a pick-rate chart is something we can start tomorrow.
References
Papers and materials referenced in this article:
・DOI: 10.1177/09567976251400333 (published online 7 January 2026, peer-reviewed. All six experiments were preregistered on AsPredicted, and materials, data and analysis scripts are public on ResearchBox.)
・Homepage of Beidi Hu (first author)
・Related work: When Choice Is Demotivating: Can One Desire Too Much of a Good Thing? (Iyengar & Lepper, 2000)
・Related work: Choice overload: A conceptual review and meta-analysis (Chernev, Böckenholt & Goodman, 2015, Journal of Consumer Psychology)
・Cited in the text as the classic on correspondence bias: The attribution of attitudes (Jones & Harris, 1967, Journal of Experimental Social Psychology)
・The game images in this article are unrelated to the paper. They were taken from Steam store pages as real games that fit the topic: Hades / Vampire Survivors / Baba Is You
Reactions (no login)
Anonymous • one of each per visitor per day
Part of these series
Paper DigestEpisode 67 of 104