PAPER-DIGEST · 2026-10-04
Choi & DeKay: Even with truly random sequences, people judged a repeat about 7 points less likely after a run of four — Fukai Reads
Judgment and decision making — the gambler's fallacy and how randomness looks
TL;DR — Do people expect a reversal even when a sequence is truly random?
Yes, they do — at least, that is how this reanalysis reads. After four balls of the same color in a row, people judged the chance that the next ball would repeat the color to be 7.17 percentage points lower, on average, than the true base rate. This held even for truly random sequences, where each ball is independent of the last.
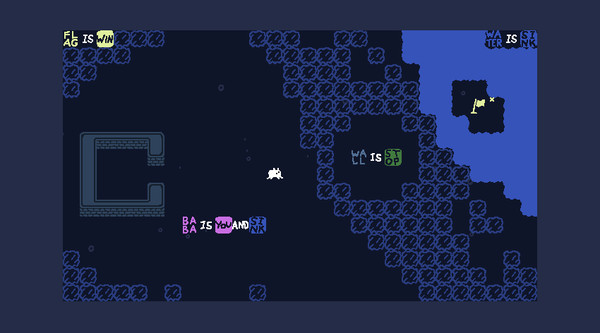
This is a peer-reviewed paper by Yeonho Choi and Michael L. DeKay of The Ohio State University (Judgment and Decision Making, 29 September 2026). They re-analyzed the data of a 2025 study that had reported that, for truly random sequences, the gambler's fallacy disappears when people give probability judgments. Analyzed differently, that conclusion did not hold. If you want the randomness in your game to feel fair, this is a paper to keep close. Gameplay from Tetris Effect: Connected (Monstars Inc., Resonair, Stage Games, 2021). Players are remarkably sensitive to perceived "streaks" in the pieces they are dealt. Image: Steam store page
Introduction — Who wrote this, and where was it published?
The authors are Yeonho Choi and Michael L. DeKay of the Department of Psychology at The Ohio State University. The paper appeared in Judgment and Decision Making, a peer-reviewed journal on judgment and decision research, as Volume 21, e26, on 29 September 2026. It is open access under CC-BY, and the data and analysis code are public on OSF.
The paper runs no new experiment. It is a reanalysis — a fresh analysis of data collected by other researchers. The target is a 2025 Psychological Science paper by Yang Xiang, Kevin Dorst and Samuel J. Gershman. Following the paper, I will call those three authors XDG.
Why did I pick it today? Because randomness in games has to do more than be mathematically correct. Players have to feel that it is fair. This paper puts concrete numbers on when that feeling drifts, and by how much.
It is too early to talk about citations. The paper is less than a week old and has not yet been widely discussed. Please keep that in mind as you read.
Background — What is the gambler's fallacy, and what was in dispute?
The gambler's fallacy is the belief that after a run of chance events, the opposite outcome is now "due". After five heads in a row, tails feels likely. In fact, the next flip is still fifty-fifty. There is also the opposite belief, the "hot hand": the feeling that a streak will keep going.
The fallacy has long been documented. It has been reported in casino records and in the decisions of umpires and loan officers. A common explanation is the representativeness heuristic — a mental shortcut that judges things by how well they match our picture of what "random" should look like. A run of one color does not look random, so we feel the other color must come to balance it out.
In 2025, XDG challenged this. For truly random sequences, they reported, the fallacy was not observed when people gave probability judgments from 0 to 100%. It appeared only when people made a binary "red or blue" prediction. So, they argued, the fallacy does not come from probabilistic reasoning, and new theories are needed. Choi and DeKay disagree.
Method — How did they re-slice the same data?
Here is the XDG task. Eight red or blue balls appear on the screen, one by one. Balls are drawn with replacement, so each is independent of the last. The participant predicts the color of the ninth ball, 18 times in all. There were five online experiments, each with 150 participants. The share of one color (the base rate) was 50%, 40% or 60%, depending on the condition.
There were two ways to answer: a slider for the probability that the next ball repeats the last color, or a binary red-or-blue button. Choi and DeKay focus on the slider. They take the judged probability minus the base rate. A negative value means the person thought a repeat had become less likely — the direction of the gambler's fallacy.
The reanalysis turns on two moves. First, combine the 40% and 60% conditions. The same people answered both, so pooling them adds statistical power. Second, split sequences by the length of the run at the end (the terminal streak). About half of XDG's sequences ended with a run of just one — the last ball had changed color. When half the sequences contain no run at all, the fallacy looks diluted.
They used several tools. Besides a rank-based test (the Wilcoxon signed-rank test), they report Bayes factors — the ratio of how strongly the data support "an effect" versus "no effect". Above 1 leans toward an effect; above 100 counts as "extreme" evidence. They also computed replication Bayes factors that use an earlier study, Rao and Hastie (2023), as the benchmark.
Finally, they tested explanatory models. One is XDG's representativeness model, revised to take run length into account. The other is the model of Rabin and Vayanos (2010), which assumes people believe random sequences alternate more often than they really do.
Findings — How big was the fallacy, and who showed it?
First, it becomes clear where XDG's claim came from. Look at Experiment 1a alone (50% base rate), without splitting by run length, and the mean is −0.67 points with a Bayes factor of 0.25 (Table 1 of the paper). That number actually leans toward "no effect". But in Experiment 2a, with the 40% and 60% conditions combined, the mean was −3.04 points, the median −1.36 points, and the Bayes factor exceeded 1,000. Combining 1a and 2a gave a Bayes factor of 973.31.
Restricting to sequences that end in a run of two or more widens the gap. For 1a and 2a combined, the mean was −3.95 points and the Bayes factor exceeded 100,000 (Table 1). By run length, the confidence intervals for the mean excluded zero at lengths 2, 3, 4, 5 and 7 (Figure 2). At length four, the mean was −7.17 points (95% CI −9.72 to −4.69) and the median −3.00 points (95% CI −6.00 to −1.00). Gameplay from Dorfromantik (Toukana Interactive, 2022). You cannot choose the tiles the stack deals you, and the feeling that "a forest must be coming soon" shapes the experience. Image: Steam store page
Interestingly, the fallacy does not keep growing as runs get longer. The authors write that judgments first fell as run length increased, then leveled out or rose again for long runs. In other words, the fallacy is strongest for medium-length runs. In the model comparison, the revised representativeness model and the Rabin–Vayanos model both fit probability judgments and binary predictions reasonably well (Figure 1).
Not everyone showed the fallacy, though. Of the 300 people in 1a and 2a combined, 72.3% leaned in the fallacy direction (negative). But only 29.0% had an individual credible interval that excluded zero. Meanwhile 27.7% leaned the hot-hand way (positive), 10.7% clearly so (Table 3). The authors themselves note "substantial heterogeneity across participants".
Use cases — What can designers do to make randomness feel fair?
From here on, these are my own takeaways. The paper is not about games, but its results map directly onto design questions. First, games where what comes next is random, such as falling-block puzzles. Players find medium-length runs the most "unnatural". Dealing pieces from a bag without repeats (a shuffle bag) likely matches the felt sense of fairness better than fully independent draws. The "seven pieces per bag" method used by many modern Tetris games can be read as an example.
Second, games that display probabilities, such as decks or gacha. Even if the display is correct, right after the same result repeats three to five times, players' estimates drift a few points from the base rate. Under this study's conditions, the mean drift at run length four was 7.17 points. Right after a run is exactly when it pays to show the odds or the remaining count to a "pity" guarantee.
Third, the weight of choosing not to put randomness in the rules. Into the Breach is a grid-based tactics puzzle released by Subset Games in 2018, in which you see what the enemies will do before they do it. Showing outcomes in advance shrinks the room for "it must miss next time" thinking to creep in. If you keep randomness, it is more honest to tune it with that drift in mind.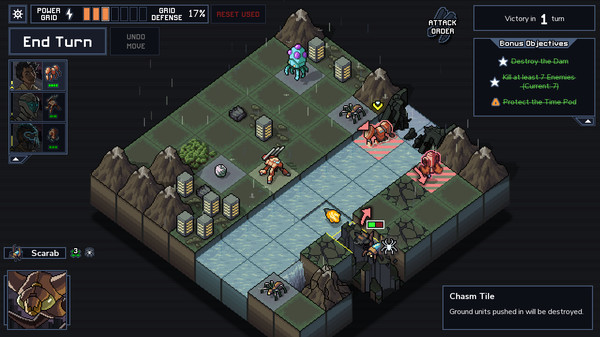 Gameplay from Into the Breach (Subset Games, 2018). Where each enemy will strike next is shown on the board in advance — a well-known example of a design that reduces moments left to luck. Image: Steam store page
Fourth, how to set up playtests. The authors propose stratified sampling — dividing the whole into groups and drawing a fixed number from each. If you show 16 sequences of eight, you could deal eight ending in a run of one, four in a run of two, two in a run of three, one in a run of four and one longer. With purely random sequences, getting an 80% chance that 100 people see a run longer than four requires 165 people; stratification guarantees it with 100. Use it whenever you want every tester to experience the "rough" stretches of your randomness.
Fifth, tuning a daily puzzle. About three in ten people clearly showed the fallacy, and about one in ten clearly showed the opposite. Randomness tuned for the "average player" may feel unnatural to the people at either end. It is worth looking at reactions after a run separately for each player.
Limitations — What can this reanalysis not yet tell us?
First, the limits the authors acknowledge. The fallacy does not appear in everyone. Even where the overall effect is clear, such as at run length four, the authors write that only a minority showed a credible fallacy at the individual level. Second, why binary predictions show a stronger fallacy than probability judgments remains not fully explained. The authors offer three hypotheses. People who say "fifty-fifty" may still bet against a streak (Farmer et al., 2017, reported that 75% of people who would bet on tails after five heads also said heads and tails were equally likely). Binary choices more easily accommodate hunches. And binary choices may involve a process of accumulating evidence in the head before deciding.
Here is what Fukai would add. First, this is a reanalysis of existing data, not a new preregistered experiment. Because the way of slicing the data can be chosen after the fact, the debate over which aggregation is "right" remains open. That said, the authors use the same statistical procedures as XDG side by side and report replication Bayes factors benchmarked on earlier work, so it is hard to read their choices as arbitrary. Second, the task is guessing the color of eight balls, with no money at stake and no player agency over outcomes. Whether the effect is as large inside a game, with losses and rewards on the line, this study cannot tell us.
Third, a sense of scale. The mean of −7.17 points at run length four is striking, but the median is −3.00 points. That reads as a few people's large deviations pulling the mean. If you use these numbers to tune a design, look at the median and the spread, not just the mean.
Fukai's reading — What does this debate mean for randomness in game design?
This part alone is my own opinion. I would place this paper as experimental support for a design rule of thumb: the fairness of randomness is decided by how the sequence looks, not by the math. What matters is not a yes-or-no on whether the fallacy exists. It is that the effect is now described in terms of how long the run is, who shows it, and by how much. In design vocabulary, it becomes a tool for treating "how randomness looks" as a distribution of run lengths rather than a gut feeling. And the stratified-sampling proposal, though a research method, reads directly as a design question: how to deal the randomness that players see. What struck me most is that what researchers worked out for fairness in their experiments takes almost the same shape as the answer for fairness in games.
Closing — What should you read next to widen the map?
If you want to go deeper, read XDG's original paper side by side with this reanalysis. Watching opposite conclusions come out of the same data is a lesson in itself. Then move on to Rao and Hastie (2023), whose task this was built on, and Rabin and Vayanos (2010), who modeled the belief that random sequences alternate a lot. That gives you a map of the theories that explain the fallacy.
On this site, Chien et al.'s study of odds framing is a close neighbor on how to present probabilities. Lohn's rock-paper-scissors study connects through people's biases when reading an opponent. People who make randomness are also designing what goes on in the heads of the people who see it. Seen that way, this small reanalysis is about something surprisingly large.
References
Papers and materials referenced in this article:
・DOI: 10.1017/jdm.2026.10047 / Data and analysis code (OSF)
・Paper re-analyzed: On the Robustness and Provenance of the Gambler's Fallacy (Yang Xiang, Kevin Dorst, Samuel J. Gershman, 2025, Psychological Science, 36(6), 451–464)
・Related work: Matthew Rabin, Dimitri Vayanos (2010). The gambler's and hot-hand fallacies: Theory and applications. The Review of Economic Studies, 77(2), 730–778.
・Related article: Chien et al. on odds framing and perceived chances of winning (Fukai Reads)
Reactions (no login)
Anonymous • one of each per visitor per day
Part of these series
Paper DigestEpisode 102 of 102