PAPER-DIGEST · 2026-09-05
Lee & Ko: Human Umpires Shrank the Strike Zone by 17 Points With Two Strikes — Fukai Reads
Human judgment bias / auditing with an automated benchmark
TL;DR
Whether a pitch is a ball or a strike is, on paper, one of the most rule-bound calls in sport. Yet people have long suspected that human umpires shift the zone with the situation. The Korean Baseball Organization's move to automated calling gave researchers a ruler to check that suspicion against.
The paper looks only at taken pitches that landed right on the edge of the zone. Under human umpires, a pitch in an 0-2 count was 17.17 percentage points less likely to be called a strike, and a pitch in a 3-0 count 6.61 points more likely (both relative to an 0-0 count). Under automation those gaps shrink to +0.33 and +0.37 points and lose statistical support.
I am reading it as a games article because it is a measurement of something designers build on purpose: a human judge who was, quietly, a difficulty adjuster. And the effect is wildly uneven across contexts. Below, where it was large and where it was near zero.
Introduction — who wrote this, and where
The authors are Kichang Lee and JeongGil Ko, of the School of Integrated Technology at Yonsei University in Seoul. The paper was posted as arXiv:2609.03786v1 on 3 September 2026, filed under cs.HC (human-computer interaction).
One thing up front. This is an arXiv preprint — a manuscript published before peer review — and it has not been peer reviewed. No conference or journal is named, and it has no citation record yet. So it should be read as a claim awaiting scrutiny, not as a settled result. I quote its numbers as printed, but I do not treat them as established fact.
I still chose it today because its shape maps directly onto game development. A call that the rulebook defines precisely was being made by a person. Then that person was replaced by a machine. Comparing before and after shows what the person had been adding. Adjudication, matchmaking, report review, hint distribution — anyone whose game has human discretion in the loop can pose the same question about their own system.
Background — why the suspicion was hard to measure
The strike zone is written into the rules as a three-dimensional region defined by the batter's stance and height. Even so, the folk claims never stop: the zone widens in a tight late inning, it shrinks once the batter is down to his last strike. The paper's opening line names the situation exactly — few calls in baseball are more rule-bound than the strike zone, and few have produced more suspicion that context matters.
The hard part is turning that suspicion into a number. A raw count of late-inning strikes proves nothing about the umpire. Pitchers change late, sequencing changes, batters' intentions change. As the authors put it, a raw difference in called-strike rate can reflect pitch selection, location, pitch type, player quality or game state rather than any shift in the umpire's judgment.
Then the KBO introduced its automated ball-strike system (ABS: the pitch location is measured and a machine decides). The authors use it not as a replacement for the human but as a ruler. Same league, same rule-defined zone; only the entity making the call changed. Any pattern that is visible under humans and gone under the machine can be attributed to the judge.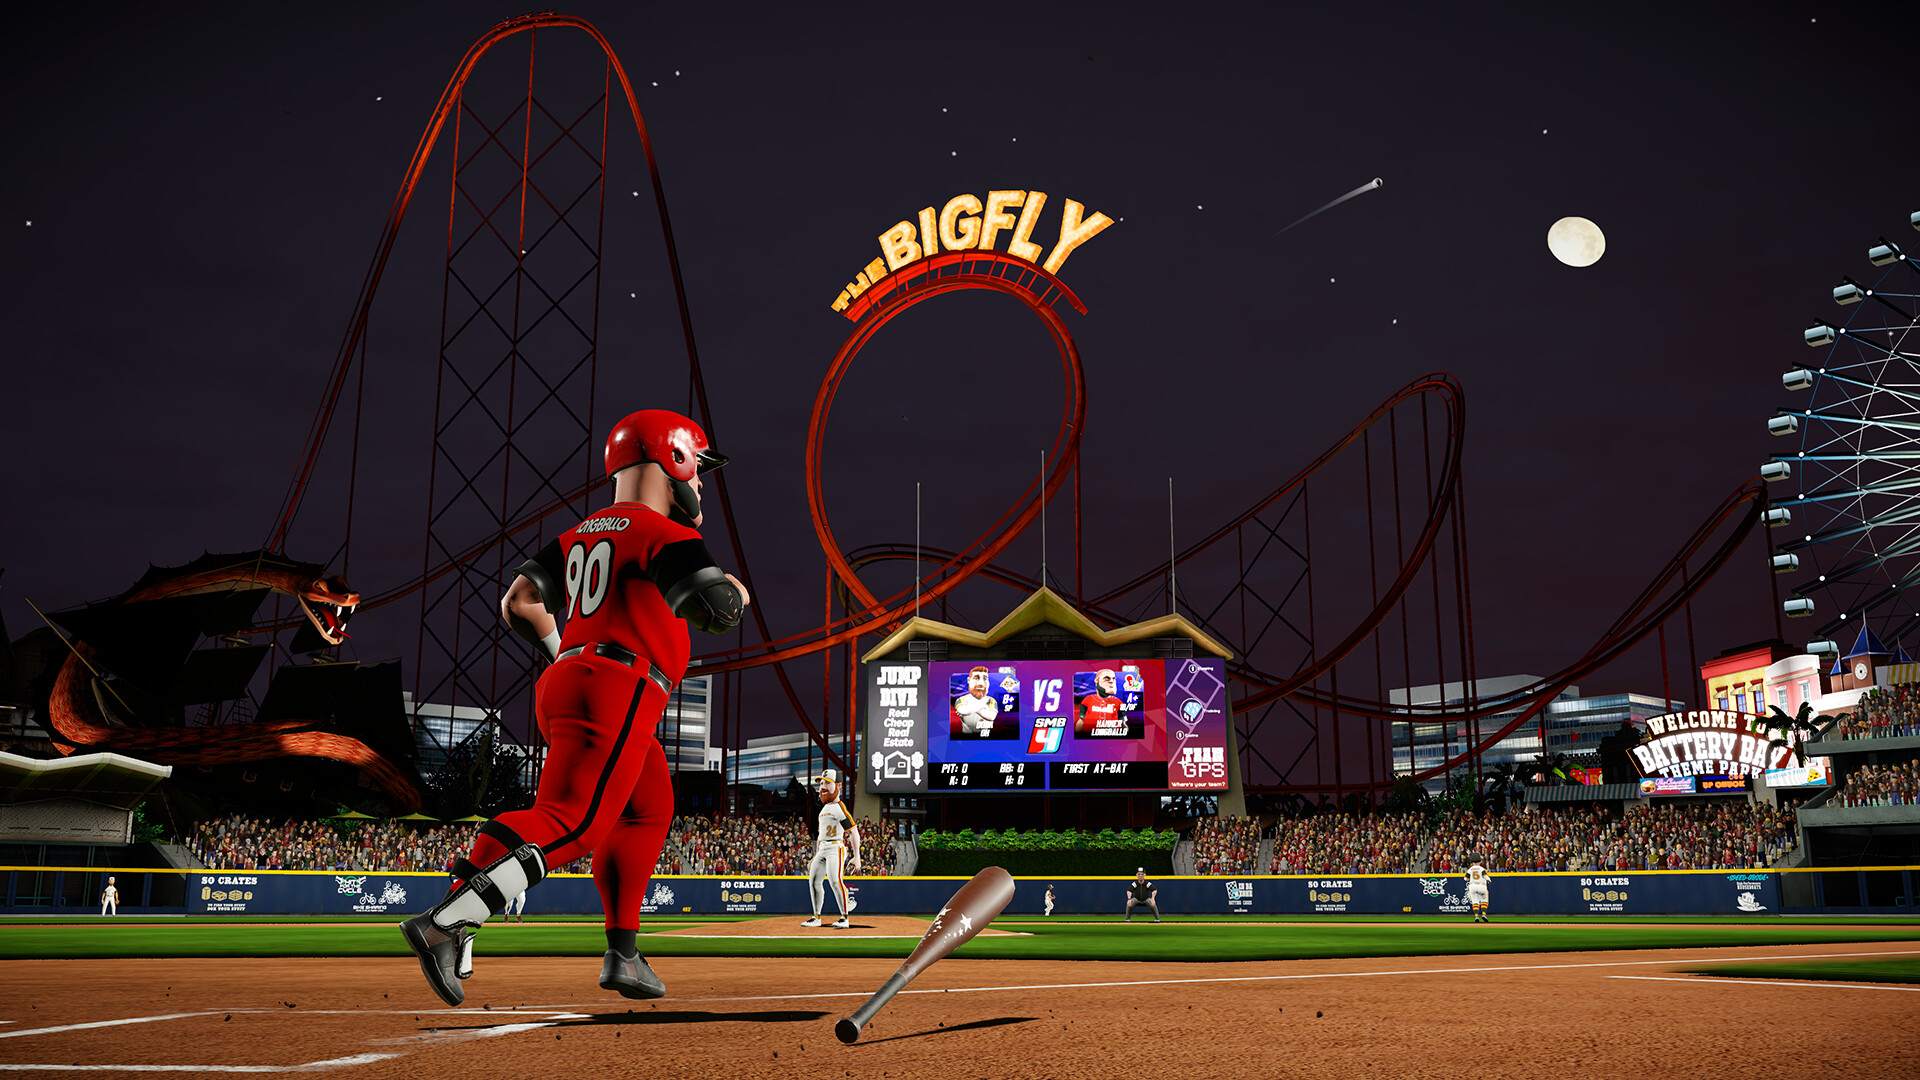 From Super Mega Baseball 4 (Metalhead Software). The strike zone is written into the rules, yet the outcome moves with who is watching.
The authors concede the ruler's limits up front. Different years mean different rosters and different strategies. Which is why the word in the paper is not "experiment" but "audit" — a careful choice that tells you a lot about how the work is pitched.
Approach — look only at the boundary band
The data is 1,216,246 pitch-level rows from 2021 through the available portion of the 2026 season. 2022–2023 is the human-umpire baseline; 2024 onward is the automated benchmark.
Not every pitch is examined. The main sample is the boundary band: taken pitches that landed within 0.25 feet (about 7.6 cm) of the nearest rule-zone boundary. A pitch down the middle is called the same way by anyone. Only pitches on the edge change hands when the effective zone stretches or shrinks a little. The band contains 209,976 called pitches across the full dataset.
The statistical tool is logistic regression (a standard model that predicts the probability of an event as a number between 0 and 1). First the model is made able to predict called-strike probability from location alone. Alongside horizontal and vertical position it includes quantities such as how far inside or outside the boundary the pitch was, and whether it was inside the rule zone at all. I use no formulas here, but the point of this stage is simple: let location soak up everything location can explain.
Only then are context variables — count, inning, player identity — added, to see whether the probability still moves. Whatever movement location could not account for becomes a candidate for a context effect.
The audit runs in five families: (1) count pressure, (2) player status, using salary as a proxy, (3) game progression by inning and score, (4) catcher and pitcher identity, and (5) home context. Because that means many tests, the authors treat only results surviving FDR correction (false discovery rate correction — a procedure that discounts for the chance hits you get when running many tests at once) as strong evidence.
Findings — 17 points for the count, one point for the clock
Count pressure was the strongest effect. In the human period, relative to an 0-0 count, called-strike probability in the boundary band was 17.17 percentage points lower at 0-2. It was 14.92 points lower at 1-2, 11.94 lower at 2-2, and still 10.49 lower on a full count (3-2). All survived FDR correction (Figure 1).
The effect runs the other way too. At 3-0, the count most favorable to the batter, called-strike probability was 6.61 points higher. Lined up, the pattern reads as this: human umpires were reluctant to make the call that ends the at-bat, and readier to make the call that keeps it going.
Under automation, the ordering vanishes. Across 2024–2026 the 3-0 effect is +0.37 points and the 0-2 effect +0.33 points; neither survives FDR correction. The authors write that the ordered human count pattern largely disappears once ball-strike adjudication is automated. Boundary-band sample sizes were 37,356 pitches in 2022 and 38,617 in 2023.
Game progression matters too, but at a different order of magnitude. In the human period, innings 1–3 ran 0.72 points fewer strikes (FDR q=0.0018) and innings 7–9+ ran 0.69 points more (q=0.0033). Pooling everything from the seventh gives +1.02 points, and restricting to late close games gives +1.38 points (q=0.0069). Score state shows the same shape: −1.94 points for a team trailing early, +1.01 points for a team trailing late. Under automation the numbers sit between 0.00 and 0.12 points, with no FDR-supported phase effect. The count story is a seventeen-point story; the clock story is a one-point story. Blur the two and you have misread the paper. The authors also note the pattern does not fit a simple "let's get this over with and go home" explanation.
Catcher identity is the second-strongest signal. In the human period, the residual variation that location could not explain had a standard deviation of 1.13 points across catchers, and the assumption of no difference between catchers is decisively rejected (p=2.24×10⁻¹⁵). Under automation the same spread collapses to 0.00 points and the difference disappears (p=0.774). For pitchers it shrinks from 1.39 to 0.12 points (Figure 7). The catcher is not the person making the call — and yet the call moved. That is the strangest finding in the paper.
Other suspicions came out weak or empty. Using salary as a proxy for status, the batter slope is −1.50 points and not significant with everyone included (p=0.496), but −3.82 points (95% CI −6.25 to −1.39, p=0.002) once one extreme individual is excluded. In other words, the conclusion turns on whether one player is in the sample. On the pitching side, higher-salary pitchers got a more favorable zone, and that held under several salary cutoffs. For home context, only one of 32 eligible umpires survived FDR correction. The authors conclude that the data do not support a broad umpire-level home-zone effect.
Their own summary captures the paper's character: the main finding is not that human umpires were biased everywhere, but that among the suspected context effects some were strong, some moderate, and some weak or largely absent.
Uses — five things a game maker can take home
(1) Any call with human discretion in it should first be measured against something that does not move. If your game has moderation review, or an LLM acting as a judge, take the same borderline cases, strip the situational context, ask again, and take the difference. That is the whole skeleton of this paper. The benchmark does not have to be accurate. It only has to be immovable.
(2) Do not look at averages. Look at the boundary band. If you want to know whether a timing window, a hitbox, or a hint threshold is drifting with context, an average over all play will show nothing. In a rhythm game, isolate inputs within a few milliseconds of the window's edge; in a puzzle, isolate boards that are one move from solved. Central cases dilute every bias there is.
(3) If you are going to adjust difficulty invisibly, decide in advance where it bites. What moved human umpires was not the clock but the count — the pitch that would end the at-bat. The gap between seventeen points and one point is a design lesson in itself. Rather than easing everything because it is late, ease only the single moment that decides the outcome. The first dilutes; the second lands. From Left 4 Dead 2 (Valve). Its AI Director is the canonical example of difficulty being moved where players cannot see it.
(4) Suspect the third party who is not making the call. The eeriest result here is the catcher effect: variation between people who were not judging anything introduced 1.13 points of spread into the judgment, and went to zero under automation. Translated into your game — does the outcome of a report depend on who filed it? Does the same action read as more of a foul depending on the animation or the camera? If a replay angle can move a review verdict, that is the catcher effect wearing different clothes.
(5) If you are going to help the player, do not hide it. Celeste's approach is to put the mercy in the options menu. What this study shows is that hidden context-sensitivity is real and shows up once measured — and that players had felt it for years, in exactly the place it turned out to live. Mercy that can be felt will eventually be quantified. Better to show it and let people choose. From Celeste (Maddy Makes Games). The opposite design stance: its assist options sit in the settings menu, in plain sight.
And a lesson pointing the other way. Automation does not only make things fair. It erases the pattern. The mercy shown to a batter down to his last strike goes, and so do the 1.38 points in a tight late inning. When you hand human discretion to a machine, what you lose is not only the bias but whatever feeling that bias was producing. How much of it to erase is a design decision.
Limitations — what the authors concede, and what I noticed
First, what the authors concede. This is not a randomized experiment. Count, inning, score, player identity, catcher assignment and home context are not randomly assigned, so — as they write — controls for location, zone, count and season cannot eliminate all confounding from pitch selection, batter approach, pitcher command or team strategy.
On ABS itself they are equally explicit: it is a diagnostic benchmark, not a randomized counterfactual. The automated period differs in rosters, strategies, league conditions and player adaptation. And because the analysis conditions on taken pitches, the sample sits downstream of swing decisions that themselves vary by count, pitcher and game state.
Three measurement weaknesses are named. The batter-specific zone fields are neither direct observations of the umpire's perceived zone nor the exact operational ABS boundary. Salary is only a proxy for reputation. Catcher identity is reconstructed from lineup data rather than pitch-by-pitch defensive tracking. This is why the paper grades its own results as strong, secondary, exploratory or null, and closes by saying replication in further seasons or leagues is needed.
Now what I noticed. (a) It is a preprint, with no peer review and no citations yet. (b) The 17.17-point figure is a difference within the boundary band, measured against an 0-0 count — it does not mean the whole zone shrank by seventeen points. It is shaped exactly like a number that gets exaggerated when quoted out of context. (c) The human-versus-machine comparison spans years, so a change in how batters take pitches changes the sample itself; if the character of taken pitches shifted under ABS, the contents of the boundary band shifted with it. (d) And extending any of this to game moderation or in-game adjudication is my extrapolation. The authors write only about baseball. Read the uses section as my proposals, not as the paper's claims.
How Fukai reads it
What follows is my own reading. I would place this study in the lineage of "use the machine to measure the human," not "use the machine to replace the human." ABS is useful here not because it is accurate but because it does not move. Insert one immovable standard and a feeling that had been drifting between superstition and conspiracy — that you don't get the call once you're down to your last strike — acquires a length: 17.17 points. In the vocabulary of design criticism, this is the work of making visible, from the outside, a dynamic difficulty adjuster that had been embedded in a person. So the lesson I take is not "stop adjusting invisibly." It is: if you are going to, hold the ruler yourself.
Closing
The paper itself is a baseball audit, but what stays with me is the method. Look only at the edge. Put an immovable standard beside the human one. Grade your evidence as strong, secondary, exploratory or null, and say which is which. All three transfer directly to reading your own game's logs.
If you want to go deeper: on difficulty and immersion, read Lu et al. on whether flow comes from difficulty or from effort; on how the format of an answer changes how hard a problem is, the Jeong et al. piece. Together they trace one line: the same problem gets harder or easier with the conditions around it. For measuring over-helpful intervention directly, Teo et al.'s Int-Bench is the closest neighbor.
This morning I printed the paper out and drew a line down Figure 1 in colored pen. From 0-2 across to 3-0, the bars flip direction cleanly. It is a figure that says its point before you read a single number. If it clears peer review, I will read it again.
References
Papers and materials referenced in this article:
・Full PDF of the same paper (all figures and numbers quoted here were checked against it)
・Author affiliation: School of Integrated Technology, Yonsei University, Seoul. No journal or conference acceptance was listed as of 2026-09-05.
・Related: Lu et al. on difficulty versus invested effort / Jeong et al. on interaction format and difficulty / Teo et al. on AI that over-assists
Reactions (no login)
Anonymous • one of each per visitor per day
Part of these series
Paper DigestEpisode 77 of 89