PAPER-DIGEST · 2026-09-10
Nagaya et al.: Delete "don't bet" from the menu, and twice as many people take the risk — Fukai Reads
Judgment and decision making — separating loss aversion from a preference for inaction
TL;DR
Picture offering the player a dangerous card. Half the time it makes them stronger, half the time weaker. Most people decline. We have explained that by saying losses feel heavier than equivalent gains.
Today's paper puts a different possibility next to that explanation. Perhaps people declined not because the loss was heavy, but because the decline option was shaped like doing nothing.
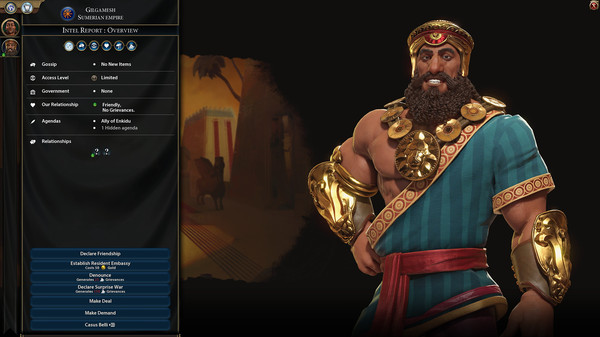
The experiments presented the very same gambles in two phrasings: "bet or don't bet", and "bet on this or bet on that". The share of people choosing the risky side rose from 23.3% to 50.0%. Not one amount or probability changed. What changed was the grammar of the menu.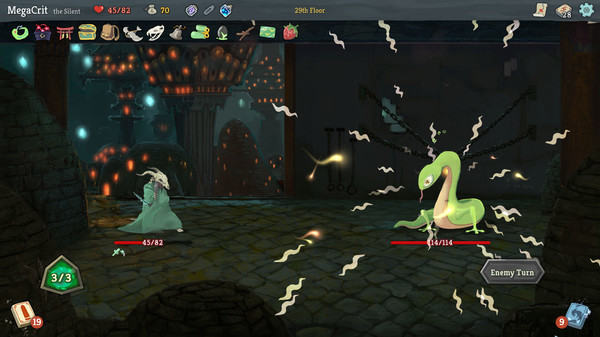 Slay the Spire (Mega Crit, 2019). Card reward screens in deckbuilding roguelites almost always carry a "Skip" alongside the cards. Image: Steam store page
Introduction — who wrote it, and where
The paper is titled "Omission matters: Reframing omission as action reduces apparent loss aversion". It appeared in Judgment and Decision Making, Volume 21, article e17, dated 13 July 2026. The authors are Kazuhisa Nagaya and Fuminori Ono of the Faculty of Education at Yamaguchi University, and Kazuya Nakayachi of the Department of Psychology at Doshisha University. It is peer-reviewed and open access.
Of the three studies, the last one, Study 2, was preregistered (a procedure in which the hypotheses and analysis plan are filed publicly before any data is collected). The registration is dated 7 May 2025; data collection began the next day. The data, the questionnaires and the analysis scripts are all posted on OSF, a public repository.
When I read a psychology result, those are the first two things I check. Was it peer-reviewed? Is the working shown? Both hold here. As for why I picked it today: when we talk about difficulty and reward design, loss aversion is usually sitting underneath the conversation as the foundation. This paper suggests that foundation may be two separate parts stacked together.
Background — the hole in how "losses loom twice as large" was measured
Loss aversion — the tendency to feel a loss more heavily than a gain of the same size — has been behavioural economics' most famous pillar since prospect theory in 1979. The rule of thumb is that losses weigh about twice as much as gains. A 2024 meta-analysis (a statistical method that pools results across many studies) put the average at about 1.955 across 607 published estimates.
The measurement recipe has long been fixed. Show a fair, break-even gamble — 50% to win x, 50% to lose x — and ask whether the person accepts or rejects. Most reject. Therefore losses weigh more. One report found the same pattern in over 50 countries, and the finding has been treated as close to a human universal.
But the recipe has a hole, the authors argue. "Reject" is also "do nothing". People have a habit of not moving when the options look close. Gal and Rucker called it inertia in 2018; in this article I will call it a preference for inaction.
Gal's line of work showed that the famous endowment effect — pricing a thing higher simply because you own it — disappears once sellers and buyers are both made to perform the same action. So the classic experiments may have been measuring "losses are heavy" and "I would rather not act" as one lump. The paper's question fits on one line: if both options are shaped like actions, do more people take the risky one?
Approach — the same gamble, asked two ways
The gambles themselves are identical across conditions. The amount lost is fixed at 3,000 yen. The amount won runs from 0 to 6,000 yen in 500-yen steps — thirteen gambles in all. The 3,000-yen gain is the exact break-even point.
Only the phrasing differs. In the action/omission condition, participants are asked "Would you bet on this gamble?" and given "bet" and "not bet". In the action/action condition, they are asked "Which of the following two 'bets' would you prefer?", with the safe side also written as a bet. Each participant is randomly assigned to one condition.
Study 1a (613 participants) presented the thirteen gambles in ascending order of the winnable amount. Because the order itself might drag answers along, Study 1b (604 participants) randomised the order separately for each person. Participants were web monitors recruited by a Japanese survey company; average age was around 53 in both studies.
Study 2 (128 participants) closed off one more doubt. The earlier wording contained "becomes 0 yen", and people have a habit of avoiding the word zero itself. So the wording began with "assume you have 3,000 yen" and became: your 3,000 yen has a 50% chance of becoming 3,500 yen and a 50% chance of becoming 0 yen, versus your 3,000 yen has a 100% chance of staying 3,000 yen. The safe side, too, is written as something that happens if you pick it.
Across the three studies, 1,345 people took part. Every gamble was hypothetical; no money actually moved. That point returns later, under limitations.
Findings — 23.3% became 50.0%
Study 1a. Averaged across the thirteen gambles, the risky option was chosen 50.0% of the time in the action/action condition and 23.3% in the action/omission condition — roughly double. The statistical model shows the framing effect clearly (b = −1.31, 95% CI [−1.41, −1.21], p < .001), alongside the unsurprising tendency for bigger winnable amounts to attract more risky choices.
The breakdown is starker. Even on the gamble with a 0-yen gain — where winning changes nothing and losing costs 3,000 yen — 36.7% of people in the action/action condition still picked the risky side. Presented as "bet or don't bet", the same gamble drew 7.3%.
Study 1b. With the order randomised, the gap widened: 47.1% versus 14.7% (b = −1.89, 95% CI [−2.00, −1.77], p < .001). On the 0-yen gamble it was 17.4% versus 1.0%.
Randomising the order also made answers less consistent. Counting how often a participant's preference flipped between adjacent gambles ordered by expected value, Study 1b averaged 1.24 flips (SD = 1.61) against 0.77 (SD = 1.07) in Study 1a — a clear difference (Welch's t-test, p < .001, d = 0.34). The neat ordering had been doing some of the thinking, one can read.
The preregistered Study 2 pointed the same way: 36.3% versus 17.6% (b = −1.08, 95% CI [−1.32, −0.84], p < .001). At the exact break-even gamble, a 3,000-yen gain, it was 41.5% versus 20.6%; at a 6,000-yen gain, 53.8% versus 34.9%.
All three studies point the same direction. In the authors' words, apparent loss aversion at small stakes diminishes substantially when people are made to choose actively between two betting options. From that they conclude that most of what has been read as loss aversion is driven by a preference for inaction.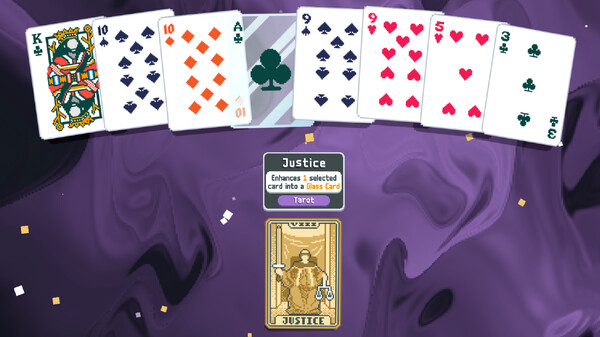 Balatro (LocalThunk / Playstack, 2024). The design keeps pushing you to play a hand or discard one; nowhere is there an option to do nothing. Image: Steam store page
Where to use it — six takeaways for people building games
Now for what a game or puzzle maker can take home. It narrows to one point: how you word the options is as strong a design variable as the numbers.
One: the "Skip" on card reward screens. In deckbuilding roguelites, three cards plus a "don't take any" is the standard shape, and that last item is an omission. If you want players to actually try the strong-but-cursed card or the risky relic, it is worth replacing "Skip" with something like "take a weak but safe fourth card", so that every item on the menu is a choosing.
Two: difficulty and assist settings. "Turn assists on / leave as is" pairs an action with an omission. Rewriting it as "play with assists / play without assists" can move the share of players who pick each. The gap here was 20–30 points, far larger than what number tuning usually buys.
Three: rerolls and swaps. Reforging gear, shuffling the board, drawing again. As long as it reads "do it / don't", the feature you most want used is the one least used. Try writing both sides as ways forward: "continue with this board / reroll and continue".
Four: how hints are sold. Daily puzzles often offer a hint at a cost. Instead of "use a hint (breaks your streak)" versus pressing nothing, make it "solve it with a hint / solve it unaided". Same cost, potentially different uptake.
Five, the reverse use. If there is behaviour you want to dampen, the omission shape is a strong brake. In loops that resemble spending or gambling, deliberately keeping a "do nothing" option works — and these numbers put the brake's strength at over 20 points.
Six, the order of your measurements. When a risky mechanic goes unused, the instinct is to touch the numbers first. After this paper, A/B testing the wording once before moving any number looks like the cheaper move.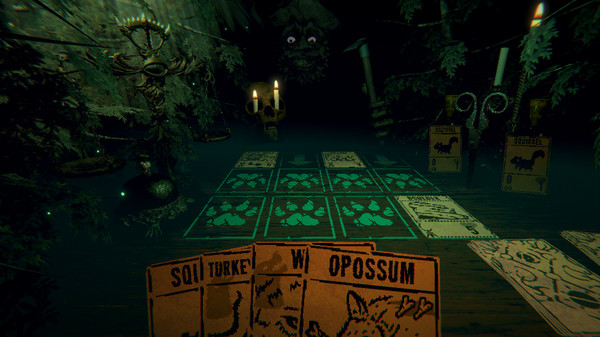 Inscryption (Daniel Mullins Games, 2021). A card game built on wagers and costs, where declining is frequently not on the menu at all. Image: Steam store page
Limitations — what the authors admit, and what I noticed
The first limitation the authors raise themselves is that they cannot separate loss aversion from aversion to uncertainty as such. Even in the action/action condition, about a third still chose the safe side on favourable gambles where the win was twice the loss. Whether that is about losses or simply about variance is undecided here. Their proposed next step is to compare gambles with no losses against mixed gambles.
The second is that no money actually moved; every gamble was hypothetical. The authors note prior work suggesting real monetary stakes increase risk aversion, and flag incentivised replication as future work. The third is that all participants were Japanese web monitors; they state plainly that cross-cultural replication is needed.
Now what I noticed while reading. The safe option in Study 2 was "your 3,000 yen has a 100% chance of staying 3,000 yen". The sentence is shaped like a bet, but the event it describes is the status quo itself. What changed is the wording, not the state. So part of the effect may be rewording rather than agency. Then again, from a designer's seat, if rewording alone moves 20 points, that is plenty to work with.
One more thing I would point out is where the evidential weight sits. Only Study 2 was preregistered, and Study 2 has the smallest sample of the three (128 people). The direction is consistent across all three, so I doubt the broad picture moves — but this is not yet "confirmed in a large preregistered sample".
And of course this is an experiment about gambles, not about games. Whether card rewards or hint purchases show the same gap is something someone has to measure on their own material. What the paper gives us is not an answer but a hypothesis worth measuring.
How Fukai reads it
Here is my own reading. I would place this study inside a longer movement in which the single big word "loss aversion" is being taken apart into components. Gal and Rucker's inertia, Ert and Erev's habit of rejecting offers that smell like a bad deal, and now this preference for inaction — each is a separate force that had been hiding under the one sign reading "losses are heavy". Translated into the vocabulary of design criticism, I read it as this: the format of a menu is functioning as part of the payoff table. When we balance a game we stare at the numbers; the column of wording next to them is pulling just as hard. There is one column that never makes it into the spreadsheet.
Closing — companions worth reading alongside it
For those who want to go deeper. Start with Gal and Rucker's 2018 paper, "The Loss of Loss Aversion: Will It Loom Larger Than Its Gain?", and you will see where today's question came from. It is the piece that first took loss aversion apart.
To check the numbers side, read the 2024 meta-analysis by Brown, Imai, Vieider and Camerer, which gathered 607 estimates from 150 articles and landed on roughly 1.955. It sits exactly opposite today's paper, which asks what that 1.955 was measuring.
On this site we have been reading a run of papers about how options are arranged: people deliberately aiming the preselected option, and the number of options distorting how we estimate someone's satisfaction. Put beside today's paper, they start to form one map of the shape of a menu.
References
Papers and materials referenced in this article:
・Data, materials and analysis scripts (OSF) / Study 2 preregistration (OSF)
Reactions (no login)
Anonymous • one of each per visitor per day
Part of these series
Paper DigestEpisode 82 of 89